


Master Backtracking: From Basics to Advanced for SDEs
1st Nov, Sat
06:25 PM - 12:53 PM
2250 registered
ISO-certified
AI Powered

Transform raw data into powerful business insights with comprehensive Data Analytics Certification Training in Jaipur. This intensive program combines statistical analysis, advanced Excel, SQL databases, Python programming, and cutting-edge visualization tools like Power BI and Tableau to prepare you for high-demand analytics roles.

150k+ Placemenets to Date

600+ Hiring Partners

76 Lakhs Highest Annual

Next Batch starts in November


This comprehensive curriculum spans statistics, database management, business intelligence tools, and Python programming. Progress from descriptive statistics and hypothesis testing to advanced Excel, SQL queries, Power BI dashboards, Tableau visualizations, and Python-driven data analysis—culminating in real-world predictive modeling and automation projects.
 Total Hours: 120+ hours of intensive data analytics trainingRegular Track: 100 days (1.5–2 hours daily)Fast-Track: 25 days (5–6 hours daily intensive sessions)Weekend Batches: Saturday–Sunday classes for working professionalsFlexible Scheduling: Morning, evening & weekend options availableHands-on labs with 70% practical learning using real datasetsClassroom training with interactive instructor feedbackOnline live classes with collaborative codingHybrid learning combining online and offline sessionsSelf-paced practice with 24/7 access to recordings and datasetsStatistics Foundation (15 hours): Probability, distributions, hypothesis testing, ANOVAAdvanced Excel & VBA (20 hours): Dashboards, macros, formulas, automationSQL Database Management (20 hours): Queries, joins, stored procedures, DB designPower BI Mastery (20 hours): DAX, dashboards, publishing, AI insightsTableau Visualization (15 hours): Maps, interactive visuals, advanced chartsPython for Analytics (30 hours): Pandas, NumPy, visualization, ML basics Statistical analysis tools Microsoft Excel (advanced functions, macros, pivot tables) Power BI & Tableau Desktop SQL (MySQL, SQL Server) Python: Pandas, NumPy, Matplotlib, Seaborn Web scraping, automation & API integrationFresh graduates seeking entry into high-growth data analytics rolesWorking professionals in finance, marketing, HR & operations looking to use analyticsBusiness analysts & consultants wanting stronger technical skillsIT professionals & developers transitioning into data rolesEntrepreneurs analyzing customers, sales & business metricsCareer changers seeking structured analytics trainingStatistical Analysis: Hypothesis testing, ANOVA, regression, chi-square, correlationAdvanced Excel & VBA: Dashboards, macros, formulas & automation workflowsSQL Expertise: Complex queries, joins, DB design, stored procedures, triggersBI Visualization: Power BI & Tableau dashboards, DAX, AI-driven insightsPython Analytics: Pandas, NumPy, visualization, automation & basic MLEnd-to-End Projects: Complete workflows from cleaning to modeling & insights
This industry-aligned curriculum in Jaipur progresses systematically from statistical foundations through modern analytics tools and programming. Each module at our Jaipur training center builds practical competency in essential technologies—Excel for business analysis, SQL for data management, Power BI and Tableau for visualization, and Python for advanced analytics—preparing you for immediate contribution in analytics roles across Jaipur’s IT sector and beyond.
Advantages & Disadvantages of Visualizations
Why Data Visualization is Important
Understanding Data
Different Types of Data Visualizations
What is Tableau?
Overview of Tableau Tool (Servers, Data, Visualizations)
Basic Charts
Text Tables
Highlight Tables
Bar Charts
Stacked Bar
Line Graphs
Dual Axis
Pie Charts, etc.
Create, Drop, Truncate, Alter, and Rename Objects
Select Statements
Grant, Revoke, and Transaction Statements
Numeric
Date and Time
LOB Types
Insert, Update, and Delete Statements
Create and Drop Databases
Examples
Start, Commit, and Rollback Statements
Identifier
Rollback and Release
Creating, Altering, and Dropping Tables
Advantages
Creating and Dropping Views
Types of Stored Objects
Inner Join
Left Join
Right Join
Deque in Python
Python Dict
Python Tuples
Python Frozenset
Difference between List, Tuple, Dict, Set, and FrozenSet
List Comprehensions
Set Comprehensions
Dictionary Comprehensions
Set Comprehensions


Apply your skills through comprehensive projects including customer segmentation analysis, sales forecasting dashboards, financial risk assessment models, marketing campaign optimization, supply chain analytics, and predictive modeling using Python—all based on authentic business scenarios and datasets. Showcase your Jaipur-developed analytics expertise to employers in local companies, national corporations, and international organizations.
Skills: Data Cleaning, Data Visualization, Business Intelligence, Excel Functions, KPIsTools: Microsoft Excel, Power BI, Tableau, SQL Description:Students will look at a company's sales data and make a performance dashboard that shows trends in revenue, best-selling products, customer groups, and sales by region. The project starts with cleaning up data, making…
Skills: Predictive Analytics, Machine Learning Basics, Data Wrangling, VisualizationTools: Python (Scikit-learn, Pandas, Matplotlib), Power BI, Tableau, Excel Description:Keeping employees is very important to businesses. Students will look at HR datasets in this project to find patterns that explain why employees leave. They will use Python to clean the data, do…
Skills: Data Preprocessing, Exploratory Data Analysis (EDA), Clustering, Data StorytellingTools: Python (Pandas, NumPy, Matplotlib, Seaborn), Jupyter Notebook, SQL, Excel Description:To grow your e-commerce business, you need to know how customers act. Students will use real-world e-commerce data to do segmentation and behavior analysis for this project. They will clean up…
Earn a Data Analyst Certification in Jaipur that is respected and recognized by leading businesses across multiple industries. This certification proves your proficiency in essential analytics tools like Excel, SQL, Python, R, Power BI, Tableau, and more. It demonstrates your ability to handle complete analytics projects—from data collection and cleaning to analysis, reporting, and visualization.
This certification helps you stand out in Jaipur’s competitive job market and opens doors to high-paying roles in IT, finance, healthcare, e-commerce, and consulting. By showcasing your practical skills and data-driven decision-making abilities, it strengthens your professional credibility and accelerates your career growth.

Professionals Trained

Countries & Counting

Corporate Served
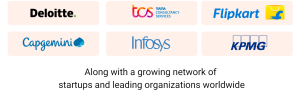
Data analysts are critical assets across every sector—from technology giants and financial institutions to healthcare, retail, and consulting firms. Our graduates from Jaipur secure analytics positions at leading organizations leveraging data-driven strategies for competitive advantage and innovation.
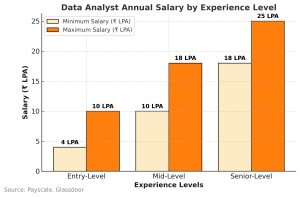
₹4–10 LPA (Entry-Level), ₹10–18 LPA (Mid-Level), ₹18–25 LPA (Senior-Level)
Data Analysts collect, organize, and analyze data to generate actionable insights and support decision-making processes.
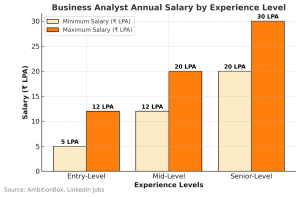
₹5–12 LPA (Entry-Level), ₹12–20 LPA (Mid-Level), ₹20+ LPA (Senior-Level)
Business Analysts identify business needs and create data-driven solutions to improve efficiency and performance.
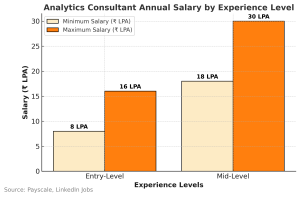
₹8–16 LPA (Entry-Level), ₹18–30 LPA (Mid-Level)

Analytics Consultants work closely with clients to provide tailored data-driven solutions and strategies for business challenges.
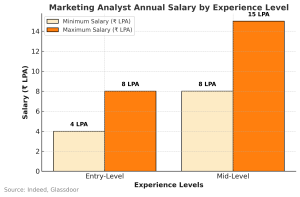
₹4–8 LPA (Entry-Level), ₹8–15 LPA (Mid-Level)
Marketing Analysts use data to evaluate marketing campaigns, identify trends, and optimize strategies for better ROI.
₹5–10 LPA (Entry-Level), ₹12–20 LPA (Mid-Level)

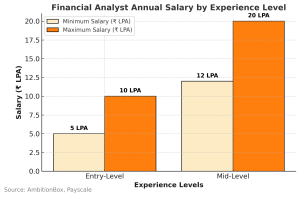
Financial Analysts use data analytics to study market trends, forecast revenues, and support investment decisions.
₹5–10 LPA (Entry-Level), ₹10–18 LPA (Mid-Level)
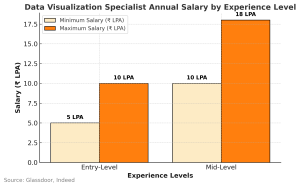
Data Visualization Specialists create compelling charts, graphs, and dashboards using tools like Power BI, Tableau, and Python libraries.
Data analysts are critical assets across every sector—from technology giants and financial institutions to healthcare, retail, and consulting firms. Our graduates from Jaipur secure analytics positions at leading organizations leveraging data-driven strategies for competitive advantage and innovation.
₹4–10 LPA (Entry-Level), ₹10–18 LPA (Mid-Level), ₹18–25 LPA (Senior-Level)
Data Analysts collect, organize, and analyze data to generate actionable insights and support decision-making processes.
₹5–12 LPA (Entry-Level), ₹12–20 LPA (Mid-Level), ₹20+ LPA (Senior-Level)
Business Analysts identify business needs and create data-driven solutions to improve efficiency and performance.
₹8–16 LPA (Entry-Level), ₹18–30 LPA (Mid-Level)
Analytics Consultants work closely with clients to provide tailored data-driven solutions and strategies for business challenges.
₹4–8 LPA (Entry-Level), ₹8–15 LPA (Mid-Level)
Marketing Analysts use data to evaluate marketing campaigns, identify trends, and optimize strategies for better ROI.
₹5–10 LPA (Entry-Level), ₹12–20 LPA (Mid-Level)
Financial Analysts use data analytics to study market trends, forecast revenues, and support investment decisions.
₹5–10 LPA (Entry-Level), ₹10–18 LPA (Mid-Level)
Data Visualization Specialists create compelling charts, graphs, and dashboards using tools like Power BI, Tableau, and Python libraries.
Navigate your professional journey with a comprehensive guide that transforms learning into opportunity. Discover proven strategies to build skills, gain experience, and secure your ideal position in today’s competitive job market.
 Building Strong Foundation
Focus on industry-relevant skills

Real-world projects to implement learned concepts.

Weekly tests to assess progress

 Sharpening Interview Readiness
Mock sessions with real-time feedback from experts

Host industry experts for advanced technical guidance

Focus on problem-solving, critical thinking, and domain expertise

 Communication & Aptitude Skill Development
Through interactive classes, students enhance both verbal and non-verbal communication, while also learning to present their ideas clearly, confidently, and effectively.

Enhances students' problem-solving, analytical thinking, and numerical ability-preparing them for competitive exams and placement tests.
 Resume building masterclasses
Help students structure professional, impactful resumes

 Bridging the Gap
* Partner with top companies for hiring pipelines * Conduct webinars and sessions with recruiters
* Connect candidates to aligned opportunities * Organize hiring events and recruitment drives
 Advance interview boot camp
Equip students to handle high-pressure interview situations
Prepare students for various interview formats, including case studies, coding rounds, and group discussions
 Personalized 1:1 guidance
* Address specific weaknesses and barriers to success. * Develop personalized improvement plans
Focus on industry-relevant skills
Real-world projects to implement learned concepts.
Weekly tests to assess progress
Mock sessions with real-time feedback from experts
Host industry experts for advanced technical guidance
Focus on problem-solving, critical thinking, and domain expertise
Through interactive classes, students enhance both verbal and non-verbal communication, while also learning to present their ideas clearly, confidently, and effectively.
Enhances students' problem-solving, analytical thinking, and numerical ability-preparing them for competitive exams and placement tests.
Help students structure professional, impactful resumes
* Partner with top companies for hiring pipelines * Conduct webinars and sessions with recruiters
* Connect candidates to aligned opportunities * Organize hiring events and recruitment drives
Equip students to handle high-pressure interview situations
Prepare students for various interview formats, including case studies, coding rounds, and group discussions
* Address specific weaknesses and barriers to success. * Develop personalized improvement plans


The demand for skilled data science professionals is skyrocketing as industries leverage data to gain strategic insights and optimize operations. Frompredictive analytics to AI-powered solutions, data science is transforming business.
Master a curriculum crafted and constantly updated by industry experts to match real-world trends, ensuring every concept and project builds job-ready, future-proof skills.
Receive one-on-one mentorship, resume reviews, mock interviews, and complete placement assistance through our 500+ hiring partners to accelerate your tech career.
Learn directly from certified professionals with years of hands-on experience who guide you through every module, project, and career milestone personally.
Gain practical exposure by working on live, industry-grade projects that mirror real business challenges, strengthening your technical execution and problem-solving abilities.
Join thousands of successful learners who have launched rewarding tech careers through Grras. Our consistent placement results, trusted partnerships, and alumni success stories speak for the quality of our training.
Our extensive network of hiring partners spans various industries, offering diverse opportunities to kickstart your career.


Yes, experienced trainers provide guidance and support throughout the program.
Yes, live Q&A sessions, mentor assistance, and discussion forums are available.
Yes, connect with peers through webinars, hackathons, and collaborative projects.
Yes, notes, datasets, and project materials are accessible even after course completion.
Because of expert-led training, hands-on projects, flexible learning, and strong placement support.
Yes, you’ll earn an industry-recognized Data Analyst Certification.
Yes, it validates your skills in Excel, SQL, Python, R, Power BI, Tableau, and end-to-end analytics.
Data Analyst, Business Analyst, BI Specialist, Reporting Analyst, Data Visualization Specialist.
Yes, with resume building, mock interviews, portfolio guidance, and job support.
Yes, skilled analysts are in demand across IT, finance, healthcare, e-commerce, and consulting.
Projects include Sales Analytics Dashboards, Customer Segmentation, Marketing Campaign Analysis, and Financial Reporting.
Yes, all projects simulate real-world business analytics scenarios for practical experience.
Yes, using Excel, Power BI, and Tableau to analyze and visualize key business metrics.
Yes, projects can be shared on GitHub, LinkedIn, and during interviews to attract recruiters.
Yes, the course emphasizes turning raw data into business decisions and measurable results.
Yes, both live online sessions and offline classroom training at Jaipur are available.
Yes, flexible schedules make it ideal for students, professionals, and career switchers.
All sessions are recorded, and you’ll get access to backup classes and resources anytime.
Yes, beginners can start learning data analysis with guided mentorship and practical exercises.
Yes, all course notes, datasets, and learning resources remain accessible after course completion.
You’ll master Excel, SQL, Python, R, Power BI, and Tableau for real-world data projects.
Yes, you’ll create dashboards, charts, and reports to communicate insights effectively.
Yes, projects use live datasets from sales, finance, marketing, and customer analytics.
Yes, you’ll apply Python and Power BI to forecast sales, customer behavior, and KPIs.
Yes, you’ll learn statistical techniques and data interpretation using Python, R, and Excel.
This course teaches data analysis, Excel, SQL, Python, R, and Power BI through real-world projects to make data-driven decisions.
Beginners, students, professionals, and anyone who wants to pursue a career in data analytics or business intelligence.
Basic Excel knowledge and understanding of statistics help, but beginners can also start step by step.
The program includes 200+ hours of practical training, live projects, and portfolio development.
You can work as a Data Analyst, Business Analyst, BI Specialist, Junior Data Scientist, or Reporting Analyst.


Copyright © 2026 GRRAS Solutions Pvt. Ltd.


 Whatsapp us
 Call us